I was on a call with a friend last year watching Bitcoin do something weird. It dropped like 8 percent in under an hour and nobody could explain why. Then someone in the group chat sent a screenshot from CoinGlass showing a massive liquidation cluster that had just been hit.
Everything made sense immediately.
I'd heard the name before but never actually sat down and learned the tool properly. So I did. And here's everything I found.
So What Even Is CoinGlass?
Let me give you the simple version first.
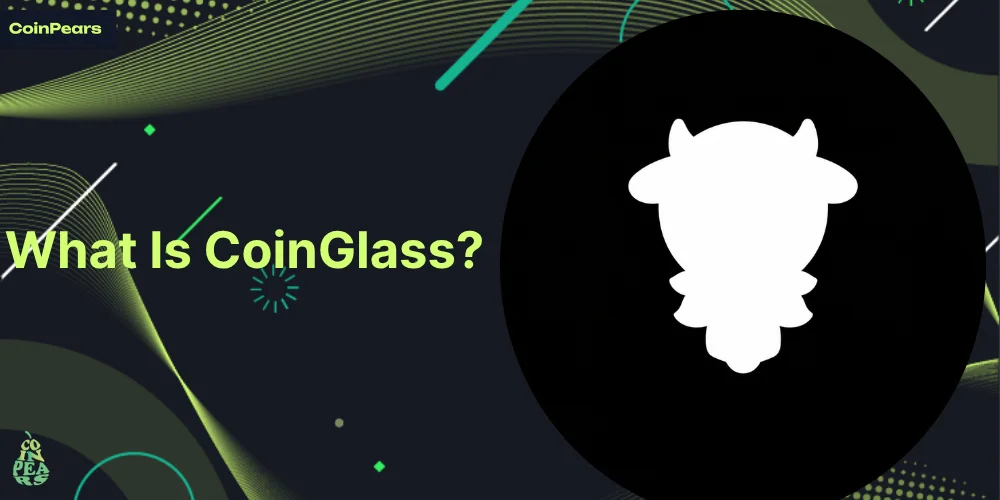
CoinGlass is a cryptocurrency market analytics platform specializing in derivatives data, liquidation tracking, and futures market insights. It's widely used by traders, analysts, and researchers to monitor leverage, open interest, funding rates, and risk conditions across major crypto exchanges.
It's not an exchange. You can't buy or sell anything on it. It's a read-only analytics platform that pulls publicly available data from exchanges. You never need to share API keys or connect accounts.
It just shows you what's happening in the market at a level most regular platforms don't.
CoinGlass was originally launched under the name Bybt and later rebranded as its scope and feature set expanded. The rebrand reflected a broader focus beyond exchange-specific metrics toward a more comprehensive view of the global crypto derivatives market.
 Who Is It Actually For?
I want to answer this early because people sometimes land on CoinGlass and get overwhelmed.
It's built for futures and derivatives traders. People who trade with leverage and need to understand where the market's pressure points are.
It collects and visualizes derivatives data from all major exchanges, including Binance, Bybit, OKX, Bitget, dYdX, CME, and more.
That cross-exchange view is the whole point. Instead of checking five different platforms, you get everything in one place.
If you're a spot trader who just buys and holds, you'll still find useful stuff here. But the real power is for anyone trading perps or futures with leverage.
The Liquidation Heatmap
This is the thing that made CoinGlass famous. And once I understood it, I got why.
Liquidation heatmaps represent one of CoinGlass's signature features, visualizing price levels where significant clusters of leveraged positions face forced closure. These maps aggregate stop-loss and margin call thresholds across exchanges, identifying zones where cascading liquidations might trigger sharp price movements.
Think about what that means. When a price level has a huge cluster of liquidations stacked up, the market tends to get pulled toward it. Because once those positions start getting wiped out, it triggers a chain reaction that pushes price further.
A liquidation heatmap visualizes price levels where leveraged positions are concentrated. When price reaches these zones, positions are forcefully closed, often causing rapid price moves. Traders use it to anticipate where price may be attracted to.
That's exactly what I saw happen in that call I mentioned. The price was getting pulled into a liquidation cluster and once it hit, everything cascaded.
The free version supports BTC and ETH with limited time ranges. CoinGlass Prime unlocks all coins, extended time ranges up to 24 plus months, and auto-refresh so you're not manually reloading during a fast market.
Open Interest Tracking
This one is huge and I don't think enough people pay attention to it.
Open interest is basically the total number of active futures contracts that haven't been settled yet. When it's rising, more money is entering the market. When it's falling, people are closing positions.
The platform breaks down open interest by exchange, contract type such as perpetual versus quarterly futures, and cryptocurrency. This granular view enables traders to identify which venues hold the majority of leveraged positions and how open interest is distributed.
Watching open interest alongside price tells you a lot about whether a move has real conviction behind it or whether it's getting thin.
A price pump with rising open interest is usually more sustainable. A price pump where open interest is flat or dropping means people aren't actually adding new positions and the move might fade.
Funding Rates
If you trade perpetuals, you need to understand funding rates. CoinGlass makes this super easy to track.
Funding rates show live rates across exchanges, indicating perpetual market sentiment.
Here's the basic idea. In perpetual futures, there's no expiry date. So the exchange charges a periodic fee between longs and shorts to keep the price anchored to the spot market. When funding is positive, longs pay shorts. When it's negative, shorts pay longs.
High positive funding means the market is heavily long and overleveraged to the upside. That's often when a correction is coming because the cost of holding gets too expensive and people start closing positions.
CoinGlass shows you funding rates across multiple exchanges at once. So you can see the full picture instead of just checking one platform.
Also Read: Caleb and Brown Crypto Review 2026: Is It Worth It?
Long and Short Ratios
The long and short ratio shows the ratio of long versus short positions on each exchange.
This is a sentiment indicator. When almost everyone is long, that's not necessarily bullish. In fact it can be a warning sign because if the market turns, all those longs become fuel for a drop.
And when almost everyone is short, a squeeze becomes more likely.
I think of it as a crowd psychology tool. The majority is often wrong at the extremes. Watching where the crowd is positioned helps you think about what the market might do to shake them out.
The ETF Flow Data
This is something CoinGlass added more recently and I think it's genuinely underrated.
CoinGlass tracks daily net inflows and outflows across every major ETF in one dashboard. Institutional appetite shown through ETF data often precedes price action, and being able to see it aggregated makes pattern recognition much easier.
Since the spot Bitcoin ETFs launched, institutional money has become a real driver of price. When you can see in real time whether institutions are piling in or pulling out, that's actually useful intelligence.
This feature alone makes CoinGlass relevant beyond just the derivatives crowd.
Legend: The Advanced Charting Tool
Legend is CoinGlass's advanced charting environment. It layers the liquidation heatmap, footprint charts, and large trade data directly onto your price candles. Instead of toggling between three different tools, you see everything in one view.
So you get the liquidity heatmap overlay directly on the price chart, footprint charts showing aggressive buy versus sell volume inside each candle, and large trade markers that highlight whale activity in real time.
For anyone doing technical analysis with a derivatives context, that's a genuinely powerful combination. You're not flipping between tabs anymore.
What It Covers Beyond Bitcoin
I want to address this because people sometimes think CoinGlass is just a Bitcoin tool.
You can track over 7,000 cryptocurrencies including Bitcoin, Ethereum, Binance Coin, Ripple, Cardano, Dogecoin, Shiba Inu, and more.
You can also check real-time market data on DeFi protocols and get top DeFi coin price movement alerts.
The 2026 update introduced new features including ETH ETF tracking and improved user interactions. Users can now even assess market sentiment through social media and news signals to help anticipate price changes.
So it's expanding well beyond just futures data. It's becoming a more complete market intelligence platform.
The Free vs Paid Breakdown
I know people always want to know this. So here it is clearly.
Core features are free including liquidation data, open interest, funding rates, and long and short ratios. The premium plan at $12 per month adds real-time data, advanced heatmaps, and historical analysis.
Twelve dollars a month is genuinely cheap for what you get. But I want to be clear that the free version is not a watered down preview. The free tier is legitimately useful rather than a hollow teaser. The data coverage across exchanges is broad and the visualizations, especially the Liquidation Heatmap, have become something of an industry standard reference point for derivatives traders.
Start free, see if it changes how you think about the market, then decide if the premium features are worth it for you.
The Mobile App
CoinGlass has an app and it's pretty solid for staying connected on the go.
The app lets you personalize price alerts for your favorite cryptocurrencies, track over 7,000 cryptocurrencies, stay updated on the latest blockchain and token trends, and create your own portfolio with a real-time portfolio tracker.
You can also view markets for top crypto exchanges including Binance, Coinbase, Kraken, Bybit, OKX, Bitget, and many more, and access detailed coin data including longs versus shorts, liquidation, open interest, and market cap.
The one complaint I see in reviews is about push notifications for alerts being inconsistent on some devices. Worth checking your notification settings after you download it.
What Makes It Different From Everything Else
There are a ton of crypto data tools out there. So what's actually different about CoinGlass?
Unlike exchange-native dashboards, CoinGlass specializes in cross-platform data synthesis, offering unified views of liquidation events, open interest fluctuations, funding rates, and long and short ratios across major trading venues.
That cross-platform part is the key. Your exchange only shows you what's happening on that exchange. CoinGlass shows you everything happening everywhere, combined into one view.
The platform also covers cycle models including the AHR999, S2F, Puell Multiple, Fear and Greed Index, exchange balances, stablecoin market cap, BTC dominance, and macro comparisons like Bitcoin versus M2 growth. It's not just a derivatives tool, it's a fairly complete picture of market structure.
That's a lot of ground for one platform to cover. And most of it is free.
How to Actually Use It as a Trader
I want to give you a practical mental model here because data without context is just noise.
Don't use CoinGlass to predict exact price levels. The Liquidation Heatmap shows estimated liquidation concentrations based on leverage and position modeling, not guaranteed price levels. It's a strong signal, not a prophecy.
Use it as one piece of the puzzle. Here's how I think about it.
Check the funding rate before entering a trade. If it's extremely positive and you're thinking about going long, you're fighting the market's cost of carry. Maybe wait for it to cool down.
Check the long and short ratio to understand sentiment. If 80 percent of the market is long, a long position puts you in the majority, which means a squeeze would go against you hard.
Look at the liquidation heatmap to understand where price might get pulled. Big clusters above or below the current price are magnets.
Then combine all of that with your actual technical analysis and make a decision. Cross-reference liquidation and open interest insights with technical analysis, on-chain metrics, and macroeconomic factors before executing trades.
That's the move. CoinGlass is a layer of context, not a crystal ball.
My Honest Take
I think CoinGlass is one of the most genuinely useful free tools in crypto.
Most data platforms either give you basic price info or charge you a lot for anything meaningful. CoinGlass sits in a different spot. The free tier is actually good and the premium is cheap.
The liquidation heatmap alone is worth bookmarking the site. I've changed how I think about market structure after using it regularly for a few months.
If you're trading futures or perps and you're not checking CoinGlass, you're making decisions without information that your counterparty probably has. That's not a great spot to be in.
FAQs
What is CoinGlass?
It's a cryptocurrency market analytics platform specializing in derivatives data, liquidation tracking, and futures market insights used by traders and analysts worldwide.
Is CoinGlass free to use?
Yes. Core features including liquidation data, open interest, funding rates, and long and short ratios are all free. Premium adds real-time data and advanced heatmaps for $12 per month.
Do I need to connect my exchange account to CoinGlass?
No. It's a read-only analytics platform that pulls publicly available data. You never need to share API keys or connect accounts.
What is the liquidation heatmap on CoinGlass?
It's a visualization of price levels where large clusters of leveraged positions are concentrated. When price hits those zones, forced liquidations often trigger rapid price moves.