Tradytics is a market analytics platform designed to help traders and investors understand market activity through structured data, indicators, and visual tools.
Over time, Tradytics has gained attention among retail traders who want deeper insights into price movement, volume behavior, and market trends across different assets.
This article explains Tradytics in a clear, neutral, and educational way, focusing on what the platform offers, how it works, and the limitations users should understand before relying on it.
The goal of this guide is not to promote Tradytics or suggest trading outcomes.
Instead, it provides factual information so readers can make informed decisions based on their own research and risk tolerance.
What Is Tradytics?
Tradytics is an analytics platform that aggregates and presents market data in a structured format.
It focuses on transforming raw trading data into charts, dashboards, alerts, and indicators that aim to help users interpret market behavior.
Tradytics is commonly discussed in the context of equities, options, and broader market activity rather than long-term investing fundamentals.
At its core, Tradytics does not execute trades or manage funds. Instead, it functions as a data and analysis layer that users can reference while making independent trading decisions.
This distinction is important because Tradytics is a tool, not a trading strategy or advisory service.
Purpose
The primary purpose of Tradytics is to organize market data into usable visual formats.
Financial markets generate massive amounts of information every second, and most retail traders lack the resources to process that data efficiently.
Tradytics attempts to bridge that gap by highlighting patterns, trends, and metrics that may otherwise be difficult to identify.
Tradytics is often used to monitor intraday activity, options flow, sentiment indicators, and relative strength across assets.
While these tools can provide context, they do not remove risk or uncertainty from trading.
Market Data
Tradytics relies on multiple categories of market data to generate its dashboards and tools. This can include price action, volume data, derivatives activity, and historical patterns.
The platform processes this information to produce indicators that users can interpret visually. It is important to understand that Tradytics does not create new market data.
It reorganizes existing data from exchanges and public sources into formats that may be easier to analyze. The accuracy of Tradytics therefore depends on the quality, timing, and scope of the underlying data feeds.
Market Insights
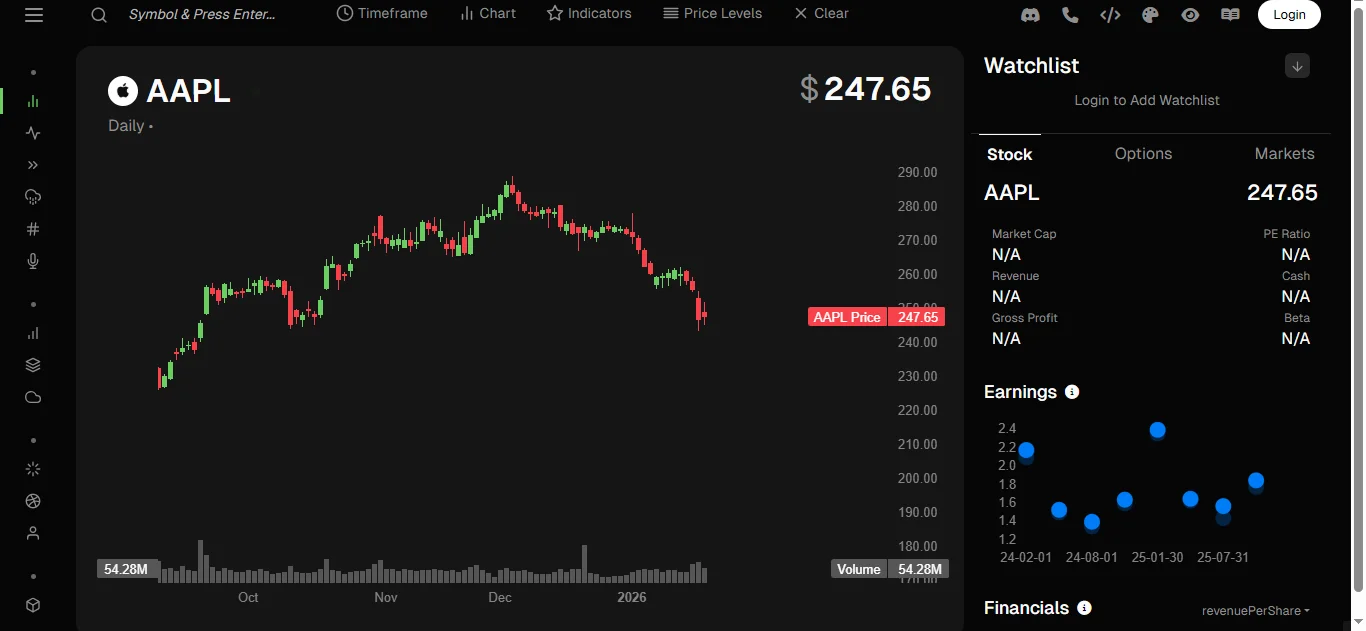
Tradytics uses charts, heatmaps, scanners, and alerts to present information. These visual tools are designed to reduce complexity by summarizing large datasets into single screens.
For example, instead of manually tracking multiple assets, users may rely on Tradytics dashboards to view comparative performance or unusual activity.
While these visuals can be helpful, interpretation still depends on user knowledge.
Tradytics does not explain what decisions should be made; it only presents data signals that require independent analysis.
Trading Styles
Different traders may use Tradytics in different ways depending on their approach. Short-term traders may focus on intraday signals, momentum indicators, or volume spikes.
Swing traders may use Tradytics to identify trend strength or broader market conditions.
Long-term investors may find less direct value, as Tradytics emphasizes market activity rather than company fundamentals.
Understanding this distinction is essential. Tradytics is generally aligned with active market monitoring rather than passive investing strategies.
Curve and User Experience
Tradytics includes a wide range of features, which can make the platform feel complex for new users.
While dashboards are visually structured, interpreting the data correctly requires prior knowledge of trading concepts such as volume, volatility, options flow, and trend analysis.
New users of Tradytics often need time to understand what each indicator represents and how it fits into a broader market view.
Without this understanding, there is a risk of misinterpreting signals or placing too much weight on isolated data points.
Limitations
Like any analytics platform, Tradytics has limitations. Market data can lag, indicators can fail in changing conditions, and historical patterns do not guarantee future outcomes.
Tradytics does not account for sudden news events, macroeconomic surprises, or unexpected market shocks in real time.
Another limitation is over-reliance. Using Tradytics as a single source of truth can lead to biased decision-making.
Data tools are most effective when combined with risk management, broader research, and independent judgment.
Risk Awareness
Tradytics does not reduce market risk. Even the most detailed analytics cannot eliminate uncertainty.
Users should understand that tools provided by Tradytics are descriptive, not predictive. They show what has happened or what is currently happening, not what will happen next.
Responsible use of Tradytics involves setting clear risk limits, avoiding emotional decisions, and recognizing that losses are a normal part of trading.
Pricing and Access
Tradytics typically operates on a subscription-based model, offering different access levels depending on features.
Pricing and plans can change over time, and users should always verify current terms directly from official sources.
Cost is an important factor when evaluating Tradytics. Users should assess whether the insights gained justify the expense relative to their trading activity and experience level.
Data Interpretation vs Decision Making
One of the most important distinctions to understand about Tradytics is the difference between data interpretation and decision-making.
Tradytics provides information, but it does not validate trade ideas or confirm outcomes.
Misuse often occurs when users treat indicators as signals rather than context. Effective use of Tradytics involves asking questions, not seeking confirmation.
Volatile Market Conditions
During periods of high volatility, Tradytics dashboards may show rapid changes in indicators.
While this can be useful for awareness, it can also increase stress and lead to impulsive decisions.
Volatile conditions highlight the importance of understanding what Tradytics is showing and why.
Indicators can behave differently when markets move quickly, and historical comparisons may lose relevance.
 Comparison
Compared to manual charting and data tracking, Tradytics offers speed and consolidation.
Instead of switching between multiple sources, users can view aggregated information in one place.
However, manual analysis allows for deeper customization and contextual judgment.
Tradytics should be viewed as a supplement rather than a replacement for fundamental market understanding.
Regulatory and Compliance
Tradytics is an analytics platform, not a broker or financial advisor.
It does not provide personalized investment advice and does not manage trades on behalf of users. This distinction matters from a regulatory standpoint.
Users remain fully responsible for their trading decisions, tax obligations, and compliance with local regulations.
Who Tradytics Is For
Tradytics may be useful for traders who already understand market mechanics and want structured data views.
Beginners may find value only after learning basic concepts. Those seeking automated trading or guaranteed outcomes will not find such features in Tradytics.
Understanding expectations helps prevent misuse or disappointment.
Common Misconceptions
A frequent misconception is that Tradytics can predict price movements. In reality, it only displays data patterns.
Another misconception is that more indicators lead to better results, which can increase confusion instead.
Clear understanding reduces the risk of overconfidence when using Tradytics.
Best Practices for Responsible Use
Responsible use of Tradytics involves combining it with education, discipline, and risk management.
Users should test interpretations in low-risk environments and avoid making decisions based solely on one metric.
Tradytics works best as part of a broader research process.
Also Read: Insig AI Share Price: A Complete Guide
Future Development
Like many analytics platforms, Tradytics may evolve over time by adding features or refining existing tools.
However, users should evaluate updates critically and avoid assuming improvements guarantee better outcomes.
Technology can support decision-making, but it does not replace judgment.
Conclusion
Tradytics is a market analytics platform that organizes trading data into structured visual tools.
It is designed to help users observe market behavior, not to predict outcomes or provide financial advice.
Tradytics can be useful for experienced traders who understand how to interpret data responsibly, but it also carries limitations and risks.
Using Tradytics effectively requires education, caution, and realistic expectations. No platform eliminates uncertainty, and all trading decisions remain the responsibility of the user.
Frequently Asked Questions
What is Tradytics used for?
Tradytics is used to analyze market data through dashboards and indicators to better understand trading activity.
Does Tradytics predict prices?
No, Tradytics provides data insights but does not predict future price movements.
Is Tradytics suitable for beginners?
Beginners may find Tradytics complex without prior knowledge of trading concepts.
Does Tradytics offer financial advice?
Tradytics does not provide personalized financial or investment advice.
Can Tradytics reduce trading risk?
Tradytics does not reduce risk; it only presents market data for interpretation.